FEATURE — ANALYSIS
Numbers keep you coming back
Logging alone doesn't tell you whether you're getting stronger. Tailrep turns your log into e1RM, volume, and consistency so you can see what to push next.
- e1RM computed for you
- Weekly volume by muscle group
- Build your own dashboard
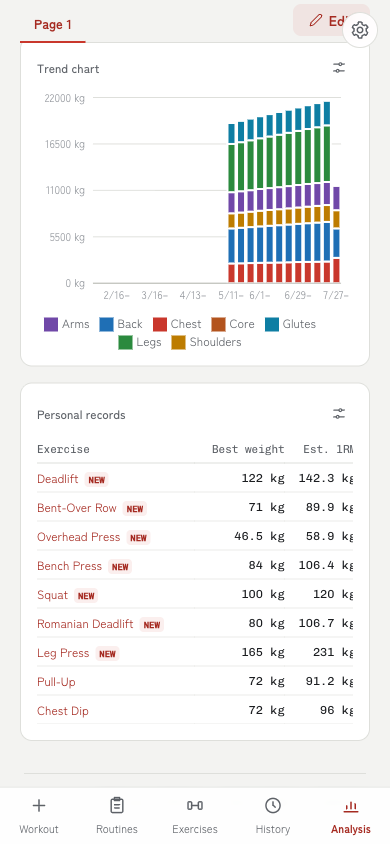
e1RM tells you if you got stronger
When both weight and reps move around, raw numbers don't compare. Converting to e1RM puts 80 kg × 5 and 70 kg × 8 on the same scale.
- e1RM computed automatically from rep-based sets
- Track each exercise's e1RM trend on a line chart
- A NEW badge marks every personal record
- Bodyweight-driven exercises use effective load including body weight
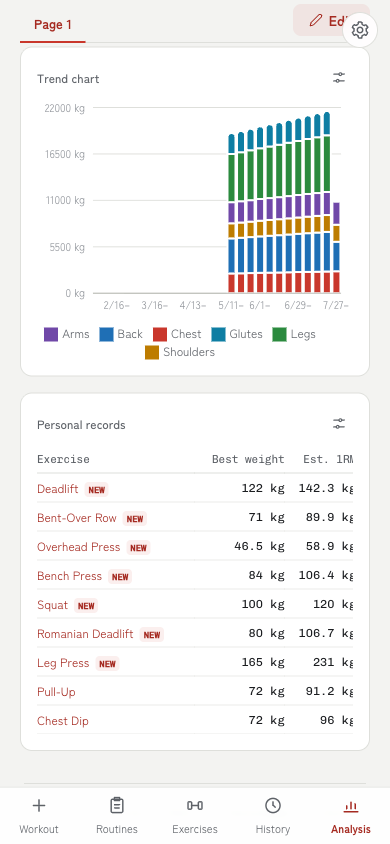
Weekly volume, split by muscle group
A stacked chart answers "am I actually training my back this week?" Each major muscle group gets its own color, so imbalance shows up as a shape.
- Weekly volume (weight × reps) stacked by muscle group
- Eight major groups, colored with a palette checked for color vision deficiency
- Switch the range to follow trends (3 months on Free, all time on Pro)
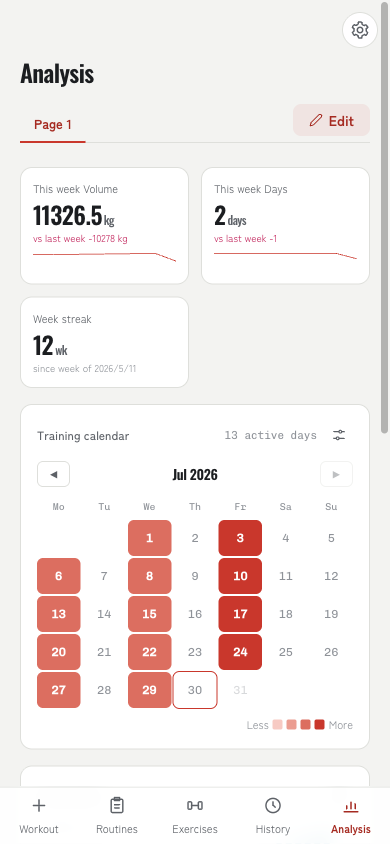
See your consistency at a glance
A calendar of training days makes gaps obvious. You notice a lapse before any number tells you about it.
- Training days laid out on a calendar
- Summary tiles for recent frequency and total volume
- Last-trained dates per muscle group help you pick what's next
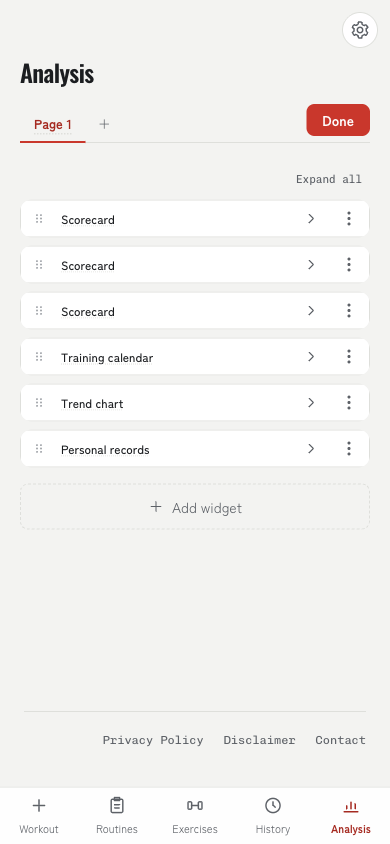
Build the dashboard you want
Everyone watches different metrics, so the widgets rearrange into your own analysis screen. Once there are a lot, Pro lets you split them across pages.
- Rearrange, add, and remove widgets
- Organize them across multiple pages (Pro)
- Per-exercise trends are always available from the exercise detail